Officials with the Federal Reserve Bank of Minneapolis say the United States has record numbers of open jobs this year, with up to two openings for every unemployed person.
But those counts of the unemployed mask a complicated picture about work in the U.S. The “unemployed” only includes nonworking people who are actively seeking jobs. There are also millions of other Americans who aren’t seeking work but say they’d like to have a job. And both groups are massively outnumbered by nonworking Americans who say they don’t want to work for reasons such as school, health, or taking care of a family.
To help sort through this complex topic, the Minneapolis Federal Reserve Bank crunched the numbers on the basics of the U.S. workforce.
This data can’t answer moral questions about who should or should not be working. But it can shed light on the underlying picture.
The basics
Start with an apparently straightforward question: What share of Americans work? The simplest answer is that around 46 percent of all Americans have full- or part-time jobs. But this stat is a little misleading: It includes millions of children and retirees whom no one expects to work. Many experts say a better number might be 76 percent, the share of workers among the population aged 25 to 54.
That 25-54 age group is called the “prime-age” workforce. It excludes young age brackets where many people are still in school, and older age brackets where retirement becomes increasingly common.
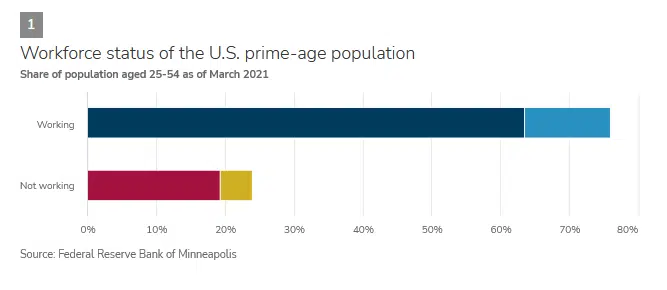
Of the roughly 76 percent of prime-age Americans who work, 63.5 percent work full-time jobs and 13.4 percent work part time.
As of March 2021, just under 5 percent of the prime-age population was actively searching for work but was unable to find a job (the unemployed). The remaining 19 percent of the prime-age population doesn’t have a job and isn’t looking for one (Figure 1).
This data comes from the federal Current Population Survey Annual Social and Economic Supplement,1 which produces detailed surveys of the American workforce every March. The most recent full survey dates from March 2021.
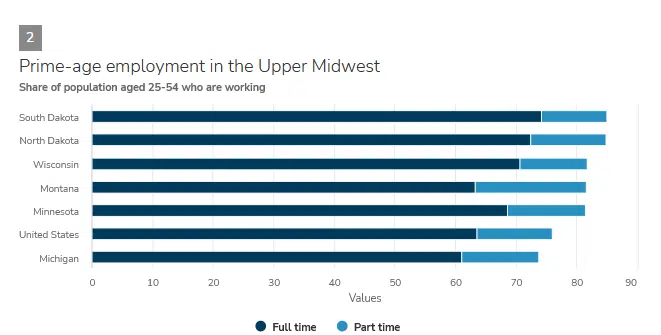
Most of the states in the Upper Midwest have prime-age employment rates above the national average of 76 percent, ranging from 81 percent in Minnesota to 85 percent in North and South Dakota—the highest rates in the country. Alaska and New Mexico have the lowest rates in the country, with fewer than 70 percent of prime-age residents working.
Montana has a relatively higher share of workers in part-time jobs than other states in this north-central region, while Michigan is the only state in the area with below-average employment (Figure 2).
In general, the U.S. “labor force” is defined as everyone who has a job or is seeking one—in other words, workers plus the unemployed. Nonworkers who aren’t seeking a job are defined as “out of the labor force.”
Reasons for not working
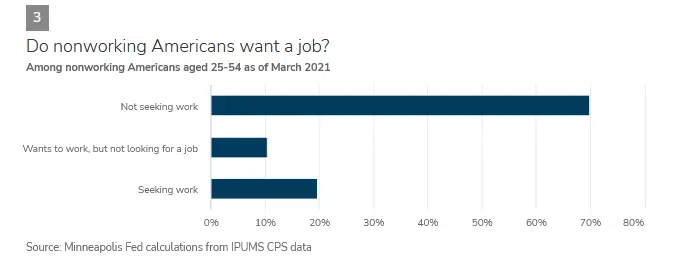
So why are 25 percent of prime-age Americans not working? For around one-fifth of nonworkers as of 2021, the answer’s easy: They want a job but can’t find one (the unemployed).
Another 1 in 10 say they’d like to work, but aren’t currently looking for a job. But most of the rest aren’t working and say they don’t want to, because they’re doing something else with their time (Figure 3).2
People’s reasons for not working vary. The single most common reason why prime-age Americans say they’re not working right now is caregiving. More than 26 percent of nonworking Americans aren’t working because they’re taking care of relatives or a household.
The second-most common reason is health. Around 22 percent say that illness or disability prevents them from working.
That’s slightly ahead of the 20 percent who are unemployed—looking for work but unable to find a job.
Others are in school, in the military, or have retired early (Figure 4).3
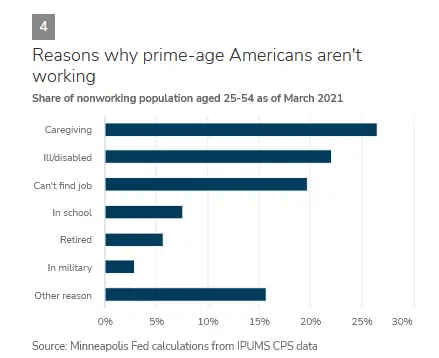
These rates aren’t dramatically different in the Upper Midwest compared to the country as a whole, except for a lower share of military service.
But these reasons for not working can vary a lot based on other factors. For example, while less than 8 percent of nonworking prime-age Americans say they’re not working because of school, 40 percent of nonworking Americans in their 20s cite school as their reason.4
On the other side, younger Americans were less likely to be out of the workforce due to disability, caregiving, or retirement.
Americans who are 55 to 64, in contrast, are unsurprisingly much more likely to be retired than the entire prime-age demographic. They also are more likely to be out of the workforce due to illness or disability, and less likely to be in school or the military.
Other factors
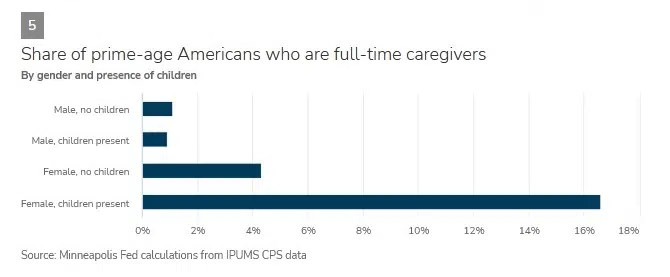
Age isn’t the only factor associated with changes in workforce participation. For example, the data show women are much more likely than men to be full-time caregivers—especially if there are children present in the home. Just 1 percent of men with children in the home are full-time caregivers, compared to more than 16 percent of prime-age women with children at home (Figure 5).
Similarly, there’s a strong association between education and the share of people not in the labor force due to illness or disability.5 Workers without college degrees are more than 4 times more likely than workers with college degrees to be off work due to health reasons (Figure 6).
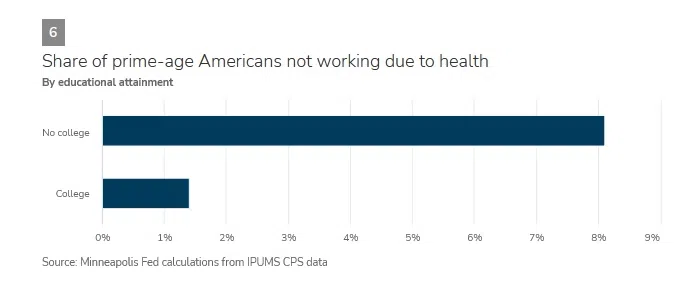
This doesn’t, of course, mean that a college education causes better health. A more likely explanation is that workers without a college education are more likely to work physically strenuous blue-collar jobs, which are directly associated with disability rates.
In future articles, the Minneapolis Fed will dive deeper into the U.S. and Upper Midwest workforces, including tracing changes over the past few decades, and breaking down the demographics behind particular reasons people don’t work.
Endnotes
1 The data was accessed via the IPUMS-CPS database at the University of Minnesota’s Minnesota Population Center.
2 The Federal Reserve classified the prime-age population from the Current Population Survey as follows. Anyone who was out of the labor force due to being in the military (“2” on the POPSTAT variable) was coded as “Military.” Anyone who had a job (“10” or “12” on the EMPSTAT variable) was classified as “Working,” with the WKSTAT variable classifying them as full time (“10,” “11,” “13,” “14,” and “15”) or part time (“12,” “20,” “21,” “22,” “40,” “41,” or “42”). Anyone with an EMPSTAT of “20,” “21,” or “22” was marked as “Unemployed.” An EMPSTAT value of “36” marked someone as “Retired.” Nonworkers who said the reason for not working was illness or disability (a WHYNWLY variable of “2”) or who weren’t working and said that they had a serious physical or cognitive disability (DIFFANY of “2”) were marked as “Ill/disabled.” (Note, since these data were from 2021, the middle of the COVID-19 pandemic, someone who had a job but was absent from work during the survey was still classified as “working,” not as “ill/disabled.”) Nonworkers who said they weren’t working because of “taking care of home/family” (WHYNWLY of “3”) were classified as “Caregiver.” And nonworkers who said they weren’t working because of school (WHYNWLY of “4”), or who weren’t working and said they were a full-time student (SCHLCOLL of “1” or “3”) were marked as “Student.” Any remaining nonworkers were marked as “Other.”
3 The Minneapolis Fed wasn’t able to categorize the reasons why about 15 percent of the nonworking prime-age Americans aren’t working from the Current Population Survey.
4 People not working due to school are not synonymous with all students. If a high school or college student has a job, even part time, they’re counted as employed. The stats in Figures 3 and 4 reflect only people who say school is the reason for not working, or who aren’t working and are also attending school full time.
5 Many people with disabilities still work full or part time. These charts are only looking at people who are out of the labor force.


Comments