Poverty rates for children (under age 18) in U.S. counties are wide-ranging, from less than 1.0% to 72.7%, according to the American Community Survey (ACS) 5-year estimates released this month (Dec. 8, 20220.
The U.S. Census Bureau’s 2017-2021 ACS differs from the 1-year estimates released in September because it pools five consecutive years of 1-year estimates. This allows us to estimate poverty in geographies with smaller populations, including all 3,143 counties in the United States.
This article focuses on the poverty rates of the nation’s youngest and oldest age groups at the county level. It also analyzes the change in rates from the 2012-2016 ACS to the subsequent period of 2017-2021.
According to the new estimates, the national child poverty rate declined from 21.2% in the 2012-2016 period to 17.0% in the 2017-2021 period. But it was still 4.4 percentage points higher than the ACS national overall poverty rate of 12.6% during the same period.
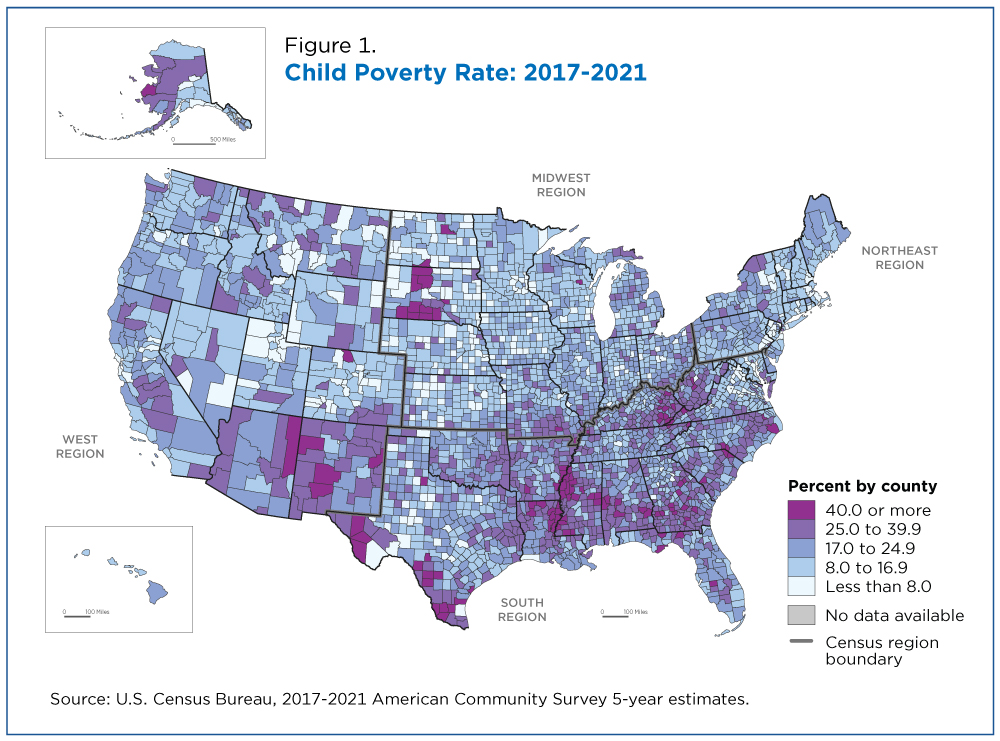
Only 117 (or 3.7%) of the nation’s counties — more than half with a poverty universe population of less than 10,000 — had poverty rates of 40% or more. The majority (81.2%) of them were in the South.
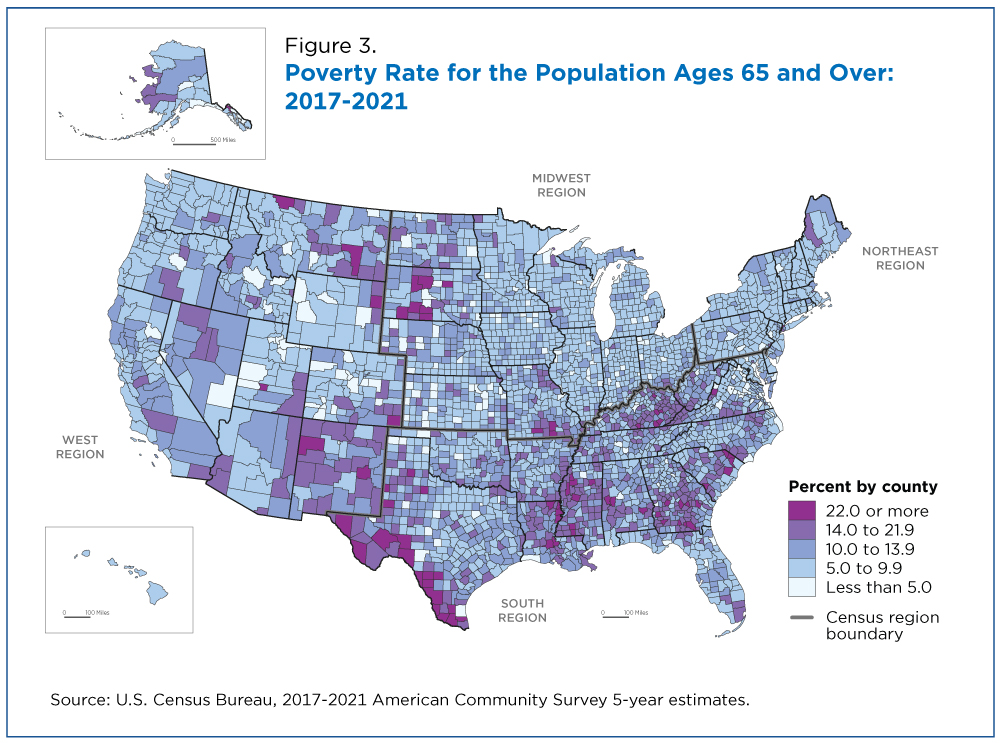
In contrast, the poverty rate (9.6%) of people ages 65 and older during the 2017-2021 period was 3 percentage points lower than the overall rate.
How Poverty Is Measured
Government agencies, researchers and local organizations regularly use poverty estimates to measure economic well-being and identify the number of individuals and families eligible for various assistance programs.
Poverty status is determined by comparing annual income to a set of dollar values (called poverty thresholds) that vary by family size, number of children and age of the householder.
The poverty threshold differs for individuals and families of different sizes.
A family and each individual member of that family are considered in poverty if the family’s before-tax money income is less than the dollar value of its threshold. Poverty status of people not living in families is determined by comparing an individual’s income to their poverty threshold.
The poverty measure excludes children under the age of 15 who are not related to the householder and people living in institutional group quarters, college dormitories or military barracks. Population totals in this article include only those whose poverty status can be determined.
Child Poverty by County and Region
Only 117 (or 3.7%) of the nation’s counties – more than half with a poverty universe population of less than 10,000 – had poverty rates of 40% or more. The majority (81.2%) of them were in the South.
Conversely, 302 U.S. counties, 9.6% of all counties, had a child poverty rate below 8%. Nearly half (146) of them were in the Midwest.
Figure 1 illustrates the uneven distribution of child poverty in U.S. counties.
Change From 2012-2016 to 2017-2021
Child poverty rates changed significantly in 1,104 counties from 2012-2016 to 2017-2021 (Figure 2):
- Child poverty rates declined in 1,017 counties.
- 43% of counties with declining child poverty rates were in the South.
- Child poverty rates increased in far fewer counties (87). Over half were in the South.
Poverty Rates of Older Populations by County and Region
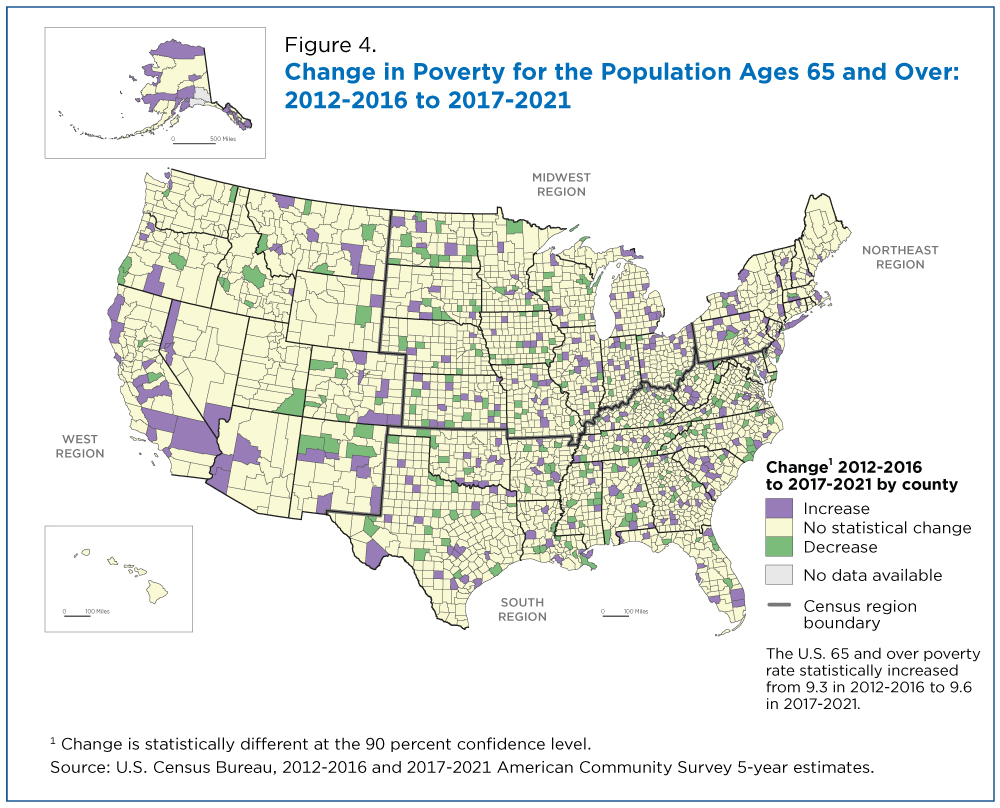
The poverty rate for people ages 65 and over increased from 9.3% in 2012-2016 to 9.6% in 2017-2021 but rates varied widely across counties – from less than 1.0% to 47.9%.
As with child poverty, there were regional clusters of high- and low-poverty counties (Figure 3).
There were 201 counties with less than 5.0% of individuals ages 65 and up in poverty; 41.8% of them were in the Midwest.
Conversely, there were 76 counties with poverty rates at or above 22.0% for people ages 65 and over; 73.7% of them were in the South.
From 2012-2016 to 2017-2021, 513 counties experienced a significant change in poverty rates for people ages 65 and over: 282 counties had an increase, and 231 counties a decrease (Figure 4).
Of the counties with declining rates, nearly 200 (86%) were in the South or Midwest. Within individual regions, 8.4% of all counties in the South had declining poverty rates; 7.6% in the Midwest; 6.0% in the West; and 2.3% in the Northeast.
Of the counties with increased rates of poverty among people ages 65 and over, 39.4% were in the South. Regionally, 14.8% of all counties in the Northeast had increasing rates compared to 11.6% in the West; 8.2% in the Midwest; and 7.8% in the South.
More counties saw poverty rates among older populations increase than decrease from 2012-2016 to 2017-2021, the opposite of the pattern seen among children.
Poverty rates among the 65-plus population increased in 282 counties from 2012-2016 to 2017-2021. Of these counties, 108 experienced declines in child poverty rates and five increases in poverty rates in both age categories.
Of the 231 counties with declining poverty rates for those 65 and over, 88 also had declining child poverty rates and four had increases.
In the Northeast, 0.9% of counties had an increase in child poverty rates but 14.8% of counties showed an increase in the poverty rate of those ages 65 and over. Similarly, only 2.7% of counties in the West had an increase in child poverty rates but 11.6% had an increase in poverty rates of the older population.
Additional poverty data are available at data.census.gov and this topics page provides links to poverty estimates from other surveys such as the Current Population Survey Annual Social and Economic Supplement (CPS ASEC) and the Survey of Income and Program Participation (SIPP). Small Area Income and Poverty Estimates (SAIPE) are also available.


Comments