More than a million people who live in Baltimore City (565,239) and Baltimore County (844,703) and thousands more tourists and commuters could be impacted in the coming months by the collapse of the Francis Scott Key Bridge on March 26.
U.S. Census Bureau data on the region’s population, demographic, economic and commuting profiles can help planners and emergency managers respond to the needs of the community and plan for its recovery.
Based on the 2018-2022 American Community Survey 5-year data, approximately 56,292 people lived in neighborhoods (census tracts) upstream from the waterway, now blocked by debris and wreckage from the fallen bridge.
The data also show this event’s potential impact on the area’s most socially vulnerable people and neighborhoods.
Workers and Residents in Baltimore City and County
According to the 2022 American Community Survey (ACS) 1-year estimates, 745,713 people worked in Baltimore city and County.
The collapse of the bridge, a major thoroughfare, will likely affect commuting patterns and complicate traffic in the area. The 2022 ACS 1-year estimates also show that approximately 66.6% of people who worked in the city and county drove alone to work.
Around 8,000 people worked at the Port of Baltimore facility and more than 15,000 jobs were directly related to the Port of Baltimore.
The collapse will also likely impact the many people living neighborhoods near the port and on the water upstream from the bridge.
Based on the 2018-2022 American Community Survey 5-year data, approximately 56,292 people lived in neighborhoods (census tracts) upstream from the waterway, now blocked by debris and wreckage from the fallen bridge. There were 34,776 workers in the civilian labor force who lived in those areas and the unemployment rate was 4.0%.
The ACS 5-year estimates also show that 14.0% of people in these neighborhoods by the waterway lived below the poverty line, compared to 19.5% in all of Baltimore city and 10.2% in Baltimore County.
It will be important for stakeholders to track how this disaster affects employment and poverty levels over the next few months.
Businesses in Baltimore City and County
There were nearly 32,626 business establishments in Baltimore city and County, according to the 2021 County Business Patterns.
The 2021 Nonemployer Statistics show there were 120,103 self-employed businesses. These businesses will likely experience delays in the transport of goods without a bridge.
The bridge collapse could also slow new home and business construction as delivery routes for supplies are disrupted.
In 2023, the Monthly Building Permit Survey found that 1,022 buildings were authorized for 2,367 new residential units. There were 25,313 applications for new businesses in Baltimore city and County in 2022, according to the Business Formation Statistics.
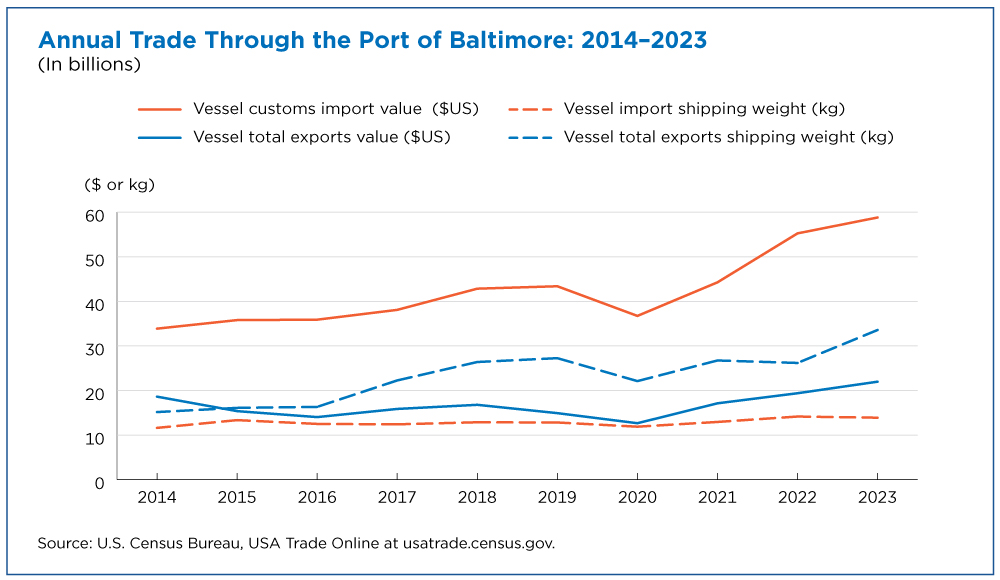
Vessel traffic in the Port of Baltimore has also been affected. In 2023, the total value of trade through the port was $80.8 billion, representing 47.4 million tons of goods, according to the Census Bureau’s International Trade Statistics.
The Port of Baltimore was also the leading U.S. port for imports of passenger vehicles ($22.4 billion), cane sugar ($410.6 million) and gypsum ($24.0 million).
Tonnage of goods exported from the Port of Baltimore more than doubled from 2015 to 2023. The top exports in 2023 were passenger cars ($4.0 billion), bituminous coal ($3.6 billion) and liquified natural gas ($2.1 billion).
Community Resilience Estimates (CRE)
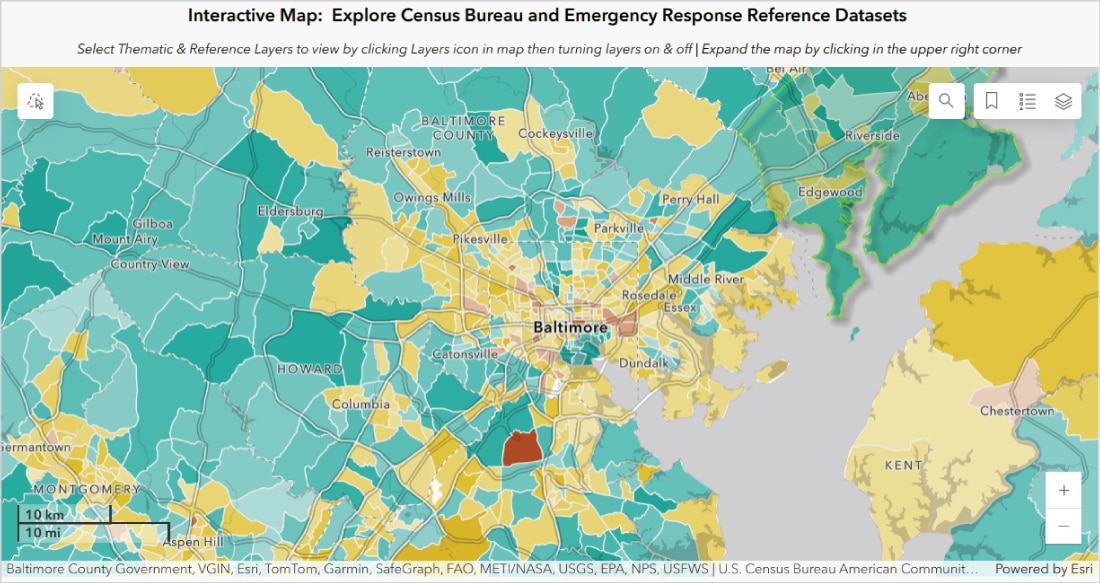
The Census Bureau’s Community Resilience Estimates provide a simple metric to help gauge the social vulnerability of every neighborhood (census tract) in the United States to disasters such as a bridge collapse, wildfire, flooding, hurricanes and a pandemic. This information is particularly important for local officials when responding to emergencies.
When we combined the areas of Baltimore City and County, we estimated that 21.7% of people were considered socially vulnerable in 2022. About a quarter of Baltimore city’s 199 neighborhoods and 4.1% of Baltimore County’s 219 neighborhoods were more socially vulnerable than the nation as a whole, on average.
Social vulnerability refers to socioeconomic and demographic factors that impact the resilience of communities. During emergencies, socially vulnerable populations are more likely than others to be adversely affected.
Modeled estimates are based on 10 components of social vulnerability including poverty, age, and access to transportation and the internet. Current estimates contain the number and percentage of residents living with 0, 1 to 2, and 3 or more components of social vulnerability for the nation, states, counties and census tracts.
The Census Bureau publishes CRE estimates to show how social vulnerability differs by neighborhood. My Community Explorer displays these estimates with real-time data on natural disasters.
As decision-makers plan recovery efforts, Census Bureau data will help them gauge the needs and vulnerabilities of communities, residents and businesses in the Baltimore region.


Comments