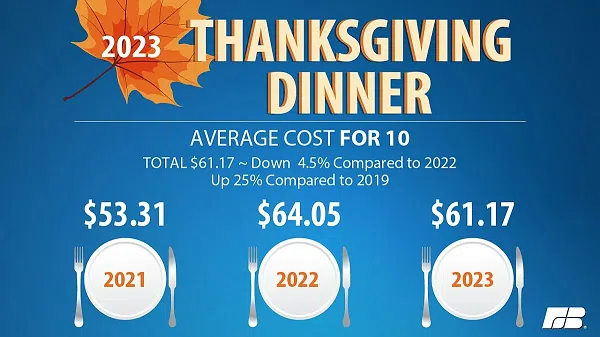
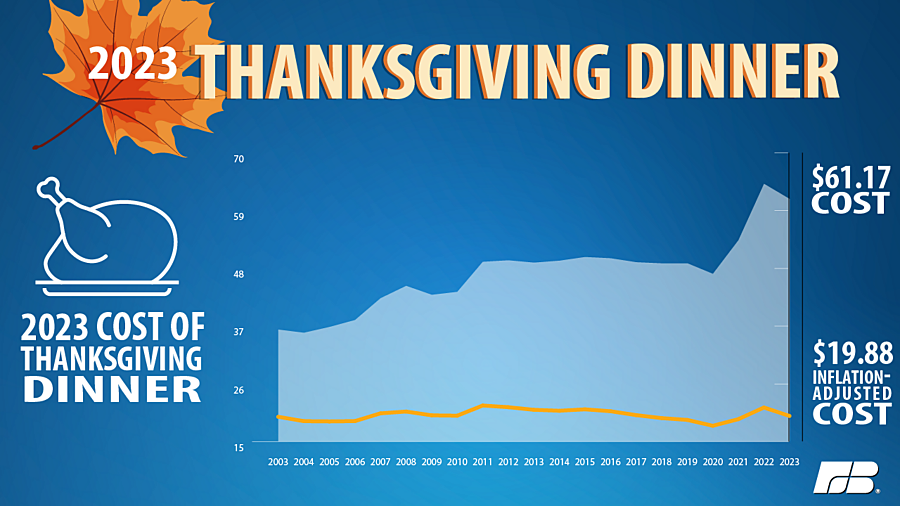
As Americans prepare for Thanksgiving, they’ll see some relief in food prices for their Thanksgiving dinner. In the American Farm Bureau Federation’s 38th annual Thanksgiving dinner survey, we find that this year’s classic Thanksgiving feast for 10 will be $61.17, or approximately $6.12 per guest. This represents a 4.5% decline from historically high prices last year, driven by a decline in the price of the Thanksgiving dinner centerpiece – the turkey. Despite the year-over-year relief, the cost is still 25% higher compared to 2019, prior to the COVID-19 pandemic.
The Survey
The AFBF marketbasket survey includes responses from all 50 states and Puerto Rico collected between Nov. 1-6, mostly consisting of “volunteer shoppers” (members checking prices) visiting their local grocery stores to survey prices of the various items used to prepare a classic Thanksgiving feast. As part of the survey tradition dating back to 1986, volunteers collect price data on turkey, cubed stuffing, sweet potatoes, dinner rolls, frozen peas, fresh cranberries, celery, carrots, pumpkin pie mix, pie shells, whipping cream and whole milk. To reflect an expanded Thanksgiving table, data on boneless ham, Russet potatoes and frozen green beans is also collected. When including the additional items, the cost of a Thanksgiving meal rose to $84.75 or $8.48 per person.
In the classic basket, seven of the eleven surveyed items saw a price decrease since last year, including turkey, cubed stuffing, frozen peas, cranberries, pie shells, whipping cream and whole milk. The price of four items rose in price year-over-year – the relish tray (a mix of fresh celery and carrots), sweet potatoes, dinner rolls and pumpkin pie mix.
Thanksgiving’s Centerpiece – The Turkey
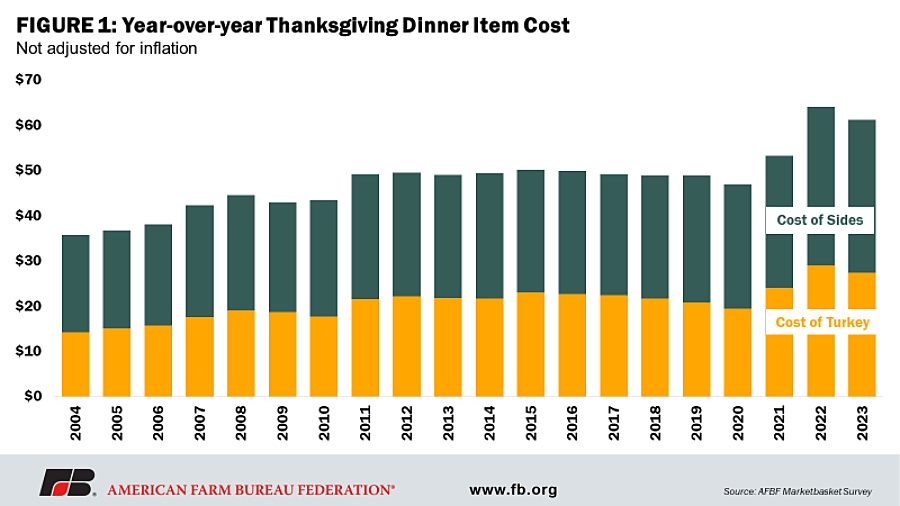
Over the past two decades, the turkey has accounted for an average of 43% of the price of the Thanksgiving dinner according to the AFBF survey, with a slight increase over time. In 2023, a 16-pound frozen whole turkey accounts for 45% of the classic Thanksgiving basket at $27.35, a 5.6% decrease from 2022. The breakdown of the cost of turkey as compared to the other foods in the classic basket is illustrated in Figure 1.
Given its prominence, the turkey is the true driver of Thanksgiving dinner prices. This year’s drop in turkey prices is attributable to a decrease in avian influenza cases and the resulting recovery in the turkey flock, as explored in a recent Market Intel.
Items with the Largest Price Changes
When considering further processed food items it is essential to remember the small role that direct agricultural market conditions have on final retail prices. Additional rounds of value added through further processing, the use of additional ingredients and promotional efforts by retailers lower the impact of farm economics on what consumers pay at the register. According to USDA estimates, the farm share, the portion of the food dollar that goes to farm establishments for the sales of raw food commodities, of a typical $1 food purchase, is only 14.5%. The remaining 85.5% is the marketing share, the portion of the food dollar that goes to food supply chain establishments for post-farm activities that transform raw food into finished food products. It’s important to keep in mind that these percentages are averages across all food. Certainly, the farm share of a more processed product, like dinner rolls, is much smaller than for food raw products like carrots and celery.
Of all items surveyed this year, pumpkin pie mix ($4.44 per 30 oz. can) and dinner rolls ($3.84 per dozen) had the largest percent increase at 3.8% and 3.0% respectively. Interestingly, the AFBF July 4th Cookout survey similarly had hamburger buns with its largest annual price increase. Of products surveyed, dinner rolls are the most likely to be prepared in-store, and thus could be impacted by sustained increases in wages due to a tight labor market.
Products with the largest percentage drop in prices included whipping cream ($1.73 per half pint) and fresh cranberries ($2.10 per 12 oz.) at a decrease of 22.8% and 18.3% respectively. For cranberries, the price drop is indicative of expanded supply, as confirmed by production estimates from the Cranberry Marketing Committee (CMC) in August which indicate a 3.6% increase from the previous year to 8,165,000 100-lb barrel equivalents. Additionally, fresh cranberry import volumes are up 33% this year-to-date (January – September), almost exclusively from Canada. Of note, approximately 95% of U.S.-utilized cranberry production is processed.
The decrease in price for whipping cream may be related to the nature of year-over-year estimates, as last year saw a 26% increase. Prices are now back in line with the status quo of previous years. Additionally, in reflection of how difficult it had become to find a ½ pint of whipping cream in stores for many of our volunteers, we changed that survey question, requesting the price for a full pint – and then recalculated it to be representative of a half-pint to maintain the status quo in our classic basket. As such, this drop may also be indicative of the discount per ounce received when buying in larger quantities. Furthermore, in fall 2022, warehouse stores of higher-fat dairy products, like butter, were down significantly from fall 2021, which helped put upward pressure on prices of those products. This year, warehouse stores of higher-fat dairy products are back in line with historical levels.
Let’s Get Regional
The survey results revealed regional differences in retail food prices, with a $5.72 spread between the least and most expensive regions. This Thanksgiving, the least expensive food region for Thanksgiving dinner is the Midwest at $58.66, followed by the South at $59.10, the West at $63.89, and the Northeast as the most expensive at $64.38.
Give Thanks for Affordable Food
From a global viewpoint, despite food inflation and supply chain problems, food is more affordable in the U.S. than in other countries. In fact, the average U.S. consumer spends only 6.7% of their disposable income on food – the lowest of 104 countries measured by the USDA in 2022 and 20% lower than the next nearest country, Singapore at 8.4%. Five countries have food expenditures that exceed 50% of disposable income, with the highest being Nigeria at 59%. The U.S. is lower than many peer nations as well, with Canadians and Australians all paying 10% of their disposable income on food.
Part of the reason food prices in the United States remain comparatively low is the presence of effective risk management and safety net programs that help stabilize agriculture markets and revenues farmers receive in an inherently uncertain and volatile industry. Many of these programs are defined and authorized by the farm bill, which expired on Sept. 30, 2023. The farm bill provides an important consistent opportunity for policymakers to address agricultural and food issues comprehensively. It has grown over the decades to serve both food and agriculture, but its roots are in farm commodity program support. The farm bill has expanded and broadened to include nutrition assistance, conservation, research, a broader swath of crops and bioenergy programs. Because of this, the farm bill brings together a diverse coalition to advocate for a legislative package composed of provisions that would likely not survive the legislative bureaucracy as stand-alone measures.
On the farm side, those utilizing farm bill programs value risk management tools that offer certainty and predictability. Tools like crop insurance products, marketing loans and commodity programs help producers manage through tough times. Voluntary, market-based incentives in conservation programs help provide producers with the tools and assistance needed to implement soil and water improvements. Rural communities have access to tools like broadband grants and new business loans authorized by the farm bill to help enhance economic development and attract growth.
On the nutrition assistance side, many families are able to put dinner on the table thanks to farm bill programs like the Supplemental Nutrition Assistance Program (SNAP). In 2022, there was an average of 41.2 million Americans receiving SNAP benefits at any given time, a full 12.6% of the U.S. population.
Just as agriculture changes and adapts to meet the needs of the time, the farm bill must do the same to serve the needs of its constituents. Every five years or so, Congress prioritizes the passage of a new farm bill to meet the challenges of an ever-changing world and ensure that critical programs continue to work for farmers and ranchers, families on a budget, and rural communities working to stay competitive.
This year, the same factors that have led to inflated prices for food and for all the things that farmers have to buy to produce that food have raised new challenges for the farm bill. Unfortunately, several programs do not automatically adjust for inflation – including spending on agricultural research and Title I commodity programs. Thus, they currently have less impact than intended when the farm bill was last passed in 2018.
Conclusion
According to AFBF’s national Thanksgiving survey, 2023 will have the second most expensive Thanksgiving meal in the survey’s 38-year history. A reduction in 4.5% of the Thanksgiving meal was predominantly driven by a reduced cost of turkey, but also by reductions in seven of eleven surveyed dinner items. Although survey prices have begun to come down, food price inflation remains a real issue and serves as a constraint on the budget of all U.S. consumers. Despite challenges with inflation and the rising cost of food, farmers and ranchers are working hard each day to provide America with a safe and affordable food supply. Food security plays a significant role in national security, and an abundant and reliable food supply is essential for any free nation. So, this Thanksgiving, as you gather around the table with friends and family, let’s also give thanks to the hard work of farmers and ranchers in providing our food and the national security and well-being that go with it.


Comments