The updated 2023 calendar year runoff forecast for the Missouri River Basin above Sioux City, Iowa, continues to be below average.
The US Army Corps of Engineers says precipitation in January was below normal for most of the upper basin except for southern South Dakota, which saw above-normal precipitation. Because of warmer-than-normal temperatures in the upper basin resulting in some snowmelt runoff, the January 2023 runoff was 134% of average (1.1 million acre-feet).
Chief of the Corps’ Missouri River Basin Water Management Division John Remus says drought conditions currently exist across most of the basin. He says despite January’s runoff being above average the 2023 calendar year runoff forecast above Sioux City is 82% of average (21.1 MAF). The runoff forecast is based on current soil moisture conditions, plains snowpack, mountain snowpack and long-term precipitation and temperature outlooks.
The plains snowpack, which typically melts from mid-February into April, is currently above normal. Two to four inches of snow water equivalent (SWE) covers eastern Montana and much of the Dakotas. Some areas in the central and eastern Dakotas are showing up to five inches of SWE.
The six mainstem power plants generated 556 million kWh of electricity in January. Typical energy generation for January is 709 million kWh. Forecast generation for 2023 is 7.6 billion kWh compared to the long-term average of 9.4 billion kWh.
To view the detailed three-week release forecast for the mainstem dams, go to http://go.usa.gov/xVgWr.
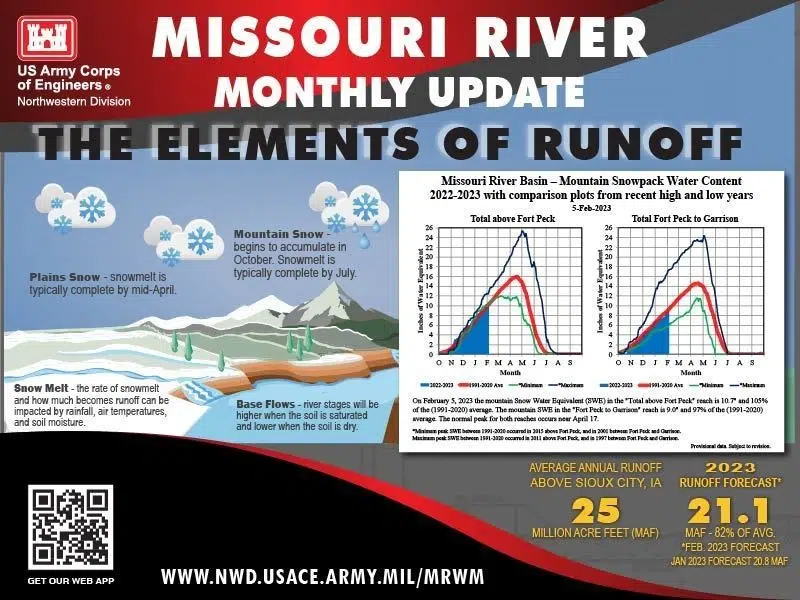
The Elements of Runoff – Mountain snowpack data for Upper Missouri River Basin Runoff – plains snow melt is typically complete by April. Mountain snow begins to accumulate in October, peaks in April and snowmelt is usually complete by mid-July. The February runoff forecast is 21.1 million acre feet.
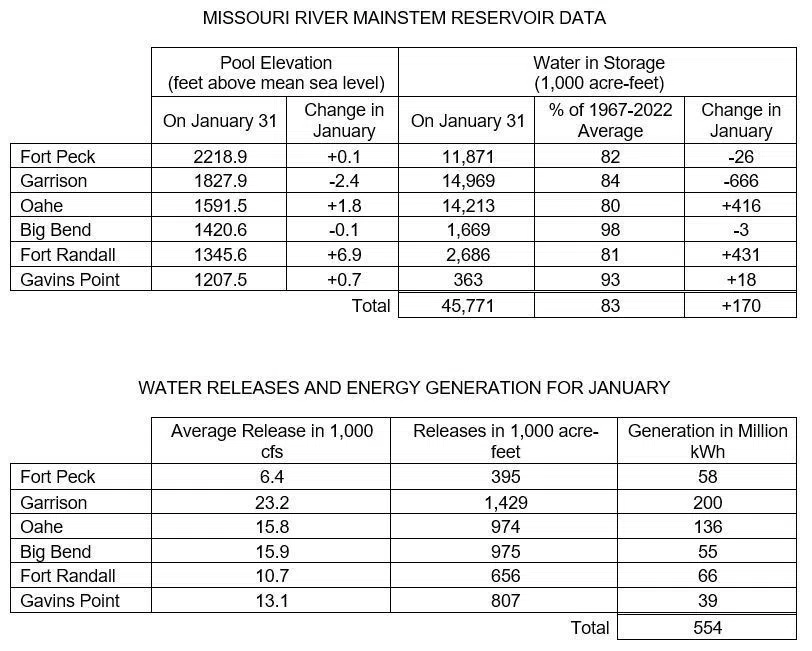
Tables showing water storage and releases and power generation.
MISSOURI RIVER MAINSTEM RESERVOIR DATA
Pool Elevation
(feet above mean sea level)
Water in Storage
(1,000 acre-feet)
On January 31
Change in January
On January 31
% of 1967-2022 Average
Change in January
Fort Peck 2218.9 +0.1 11,871 82 -26
Garrison 1827.9 -2.4 14,969 84 -666
Oahe 1591.5 +1.8 14,213 80 +416
Big Bend 1420.6 -0.1 1,669 98 -3
Fort Randall 1345.6 +6.9 2,686 81 +431
Gavins Point 1207.5 +0.7 363 93 +18
Total 45,771 83 +170
WATER RELEASES AND ENERGY GENERATION FOR JANUARY
Average Release in 1,000 cfs
Releases in 1,000 acre-feet
Generation in Million kWh
Fort Peck 6.4 395 58
Garrison 23.2 1,429 200
Oahe 15.8 974 136
Big Bend 15.9 975 55
Fort Randall 10.7 656 66
Gavins Point 13.1 807 39
Total 554


Comments